Thingiverse
Tactile Covid R Transmission Graph by ML_Makerspace
by Thingiverse
Last crawled date: 2 years, 10 months ago
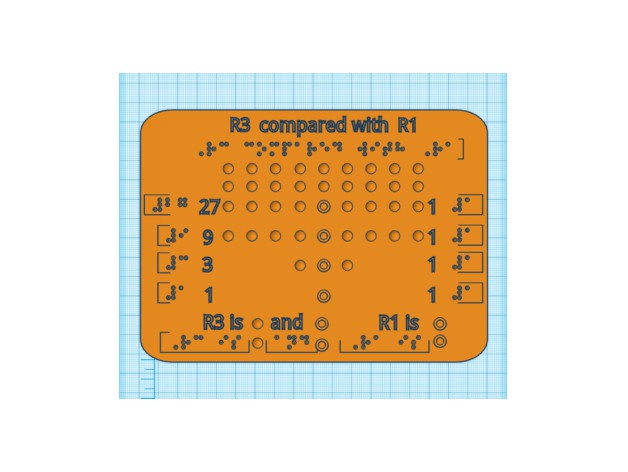
Tactile R Naught or R0 Transmission Graph
This is a tactile graph, providing information on the difference between R3 and R1 transmission rates of a virus. Here is an article that explains R0. https://www.healthline.com/health/r-nought-reproduction-number
This graph provides a tactile opportunity to understand how the larger an R is, the more transmittable a virus becomes.
Please note that Braille is uncontracted. If you would like a contracted version please comment, or remix!
This project was inspired by a student project at HTW Berlin (University of applied Science), Industrial Design Students @ HTW Berlin (University of applied Science). In collaboration with See3D, https://see3d.org/, I used the spirit of the project; developing a tactile explanation of R0. The original project was a unique design with a mechanism to change R rates. [Thank you to the students' teacher Sofia Fernandez for her assistance too].
This new design was developed in Tinkercad and is a simple tactile card design. A version of R2 vs R1 can be designed if there is interest. I can adjust the bump sizes and work on R4 and R5 too.
Print time is approximately 2.5 hours with flat orientation. However, for improved Braille printing, please print vertically. 3d printed FDM Braille is much better when printed vertically. The vertical print will take 8 hours.
Similar models
thingiverse
free

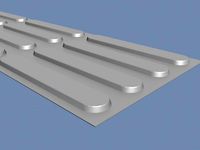
Tactile Bar Graph by ML_Makerspace
...ture version could include braille numbers between each slot. we would need to adjust distance between slots to make more space.
thingiverse
free

Tactile Graphs for Early Grades by NicholasBuilds
...thematics lesson for grades 2-4 helps students to generate data, graph the data, add depth to the graph and 3d print the graph(s)
thingiverse
free

Area of a Circle - Tactile Geometric Proof
...roof in early high school mathematics. this tactile version allows blind or low vision students to access the concept themselves.
grabcad
free

Nokia 3310 / 2000
...nokia 3310 / 2000
grabcad
this project was done for student cad training program in 2004 at university of applied science fhnw
thingiverse
free

Braille Quadrant Graph Math Board by ATNeal
... can graph plot point with total tactile response even having the "x" and "y" sections marked out in braille.
grabcad
free

Student ring
...student ring
grabcad
the ring of ttk university of applied sciences student. size 22mm
grabcad
free

Nokia 3310 2017
...nokia 3310 2017
grabcad
this project was done for student cad training program in 2016/17 at university of applied science fhnw
thingiverse
free

Weak Positive Tactile Graph by NicholasBuilds
...weak positive tactile graph by nicholasbuilds
thingiverse
example of a weak positive scatter plot for visually impaired students
thingiverse
free

Water cycle with braille, print and tactile images by leonah
...kly. it is recommended that the pieces be used on a non-slip surface, or that non-slip matting be added to the base of the tiles.
thingiverse
free

Tactile Braille Dice by Zulloc
...tactile braille dice by zulloc
thingiverse
a 3cmx3cmx3cm tactile braille dice for blind or sighted players.
Makerspace
thingiverse
free
Milwaukee Makerspace by raster
...milwaukee makerspace by raster
thingiverse
a line rendition of the milwaukee makerspace logo.
thingiverse
free

Milwaukee Makerspace by raster
...milwaukee makerspace by raster
thingiverse
a stippled rendition of the milwaukee makerspace logo.
thingiverse
free

Portachiavi Makerspace by MattewScongiu
...portachiavi makerspace by mattewscongiu
thingiverse
portachiavi laboratorio makerspace itis einstein roma
thingiverse
free

Lulea Makerspace by juntti99
...lulea makerspace by juntti99
thingiverse
was bored one day and thought does our makerspace have a 3d logo yet.
thingiverse
free

MAKERSPACE by MakerHelle
...e: rockwell extra bold, width 65% and 490 high
k: p-something (see pic), width 100% and 490 high and 330 wide
cut in 4 mm plywood
thingiverse
free

Makerspace Starter Kit by DesignMakeTeach
... facebook.com/designmaketeach. i love to talk with teachers, designers and makers about 3d printing, stem and learning by making.
thingiverse
free

Coventry Makerspace Keyring by DD28
...y makerspace keyring by dd28
thingiverse
first attempt at using openscad to create a keyring design for the coventry makerspace.
thingiverse
free

Beijing Makerspace Badge by AzureViolin
...g makerspace badge by azureviolin
thingiverse
3d printed version of beijing makerspace badge, with a flashing led in the middle.
thingiverse
free

Makerspace Urbana Logo by DocJames
...rspace urbana logo by docjames
thingiverse
the logo for the urbana, illinois, usa makerspace rendered in 3d.
made with openscad.
thingiverse
free

PORTACHIAVI MAKERSPACE V3 V4 by MattewScongiu
...portachiavi makerspace v3 v4 by mattewscongiu
thingiverse
portachiavi makerspace corretto
Graph
3d_ocean
$4

Graph
...graph
3docean
arrow business chart diagram graph graphic infographic math mathematics office table
3d model of a graph
design_connected
$18

Graph 301
...graph 301
designconnected
wilkhahn graph 301 computer generated 3d model. designed by jehs+laub.
turbosquid
$2

Traffic Graph
... available on turbo squid, the world's leading provider of digital 3d models for visualization, films, television, and games.
turbosquid
$1

Arrow Graph
... available on turbo squid, the world's leading provider of digital 3d models for visualization, films, television, and games.
3d_export
$8

Arrow Graph 3D Model
...arrow graph 3d model
3dexport
graph animated arrow results financial c4d concept chart
arrow graph 3d model xellow 57982 3dexport
3ddd
free

Wilkhahn / Graph
...ahn / graph
3ddd
wilkhahn , кресло
сайт производителя www.wilkhahn.com
текстуры в архиве
3ddd
free

Стол&Стул Graph
... fiam
стол&стул graph был спроектирован дизайнером xavier lust специально для итальянской компании fiam
3ddd
$1

Wilkhahn / Graph
...wilkhahn , кресло
сайт производителяhttp://www.wilkhahn.com/
текстуры в архиве
turbosquid
$39

Graph Glass Table
... available on turbo squid, the world's leading provider of digital 3d models for visualization, films, television, and games.
turbosquid
$5

Bar Graph Icon
... available on turbo squid, the world's leading provider of digital 3d models for visualization, films, television, and games.
Tactile
turbosquid
$9

Tactile
...id
royalty free 3d model tactile for download as max and fbx on turbosquid: 3d models for games, architecture, videos. (1656757)
3ddd
free

Baxter Tactile
...baxter tactile
3ddd
baxter
кресло baxter tactile, арт. 5263
размеры: 120x94x62 высота
design_connected
$29

Tactile Sofa
...tactile sofa
designconnected
baxter tactile sofa computer generated 3d model. designed by de cotiis, vincenzo.
3ddd
$1

TACTILE SOFA BAXTER
...a baxter
3ddd
baxter , tactile
tactile sofa baxter
320x102 h62
max 2014+ max 2011+ fbx
turbosquid
$15

TACTILE-ARMCHAIR
... available on turbo squid, the world's leading provider of digital 3d models for visualization, films, television, and games.
3d_export
$5
Directional tactile 3D Model
...tactile 3d model
3dexport
directional tactile braille tile flooring interior
directional tactile 3d model renob000 71068 3dexport
turbosquid
$2

D1.C4.22 Electrical touch switch-Apagador Tactil
... available on turbo squid, the world's leading provider of digital 3d models for visualization, films, television, and games.
3ddd
free

LACY X
...is subtly raised from the wool background, producing a tactile 3d...
3ddd
$1

Sony xperia u phone android
...portable xperia u android , телефон , sony écran tactile tft anti-rayures 3.5" 16 millions de couleurs, 854 x...
3ddd
$1

de sede \ DS-291
...full grain and nappa leathers, offering a visual and tactile experience. combines perfectly with other furniture. also available with...
Ml
turbosquid
free

Paper cups set, 110 ml, 165 ml, 175 ml, 210 ml, 250 ml, 500 ml.
... available on turbo squid, the world's leading provider of digital 3d models for visualization, films, television, and games.
turbosquid
free

Milk and Juice pack, 1l, 500 ml, 200 ml
... available on turbo squid, the world's leading provider of digital 3d models for visualization, films, television, and games.
turbosquid
free

Milk and Juice pack, 1l, 500 ml, 200 ml
... available on turbo squid, the world's leading provider of digital 3d models for visualization, films, television, and games.
3ddd
$1

Downy parfum 900 ml
...downy parfum 900 ml
3ddd
downy parfum 900 ml
3d_export
$36

3D 4 Aluminium Soda Can with drops - 280 ml 330 ml 450 ml 500ml
...lution (in separate zip-archive); -renders for preview are made in 3ds max 2020, v-ray next; -studio environment is not included;
turbosquid
$39

Infinity Ml wheel
... available on turbo squid, the world's leading provider of digital 3d models for visualization, films, television, and games.
turbosquid
$29

Infinity Ml rim
... available on turbo squid, the world's leading provider of digital 3d models for visualization, films, television, and games.
turbosquid
$28

Constantin armchair ML
... available on turbo squid, the world's leading provider of digital 3d models for visualization, films, television, and games.
turbosquid
$10

5000 ml canistre
... available on turbo squid, the world's leading provider of digital 3d models for visualization, films, television, and games.
turbosquid
$9

Vial 5 ml
...d model vial 5 ml for download as max, 3ds, obj, fbx, and dae on turbosquid: 3d models for games, architecture, videos. (1714146)
Covid
turbosquid
$6

covid
...d
turbosquid
royalty free 3d model covid for download as max on turbosquid: 3d models for games, architecture, videos. (1667862)
3d_export
$50

covid-19
...covid-19
3dexport
3d obj model. covid-19
3d_export
$11

covid-19
...covid-19
3dexport
this is 3d model about covid-19 virus
3d_export
$10
covid 3d mask
...covid 3d mask
3dexport
3d covid mask for 3d avatars to implement in covid information projects
3d_export
$5
covid-19 korona
...covid-19 korona
3dexport
covid-19
3d_export
$8

coronavirus covid-19
...coronavirus covid-19
3dexport
coronavirus covid-19
3d_export
$5

covid mask black
...covid mask black
3dexport
black covid mask
3d_export
$5

coronavirus covid-19
...coronavirus covid-19
3dexport
coronavirus covid-19
turbosquid
$29

Covid Collection
...quid
royalty free 3d model covid collection for download as on turbosquid: 3d models for games, architecture, videos. (1682309)
3d_export
$5
mask covid-19
...mask covid-19
3dexport
covid-19 virus protection mask
Transmission
3d_export
$5
transmission gearbox
...transmission gearbox
3dexport
transmission gearbox
archibase_planet
free
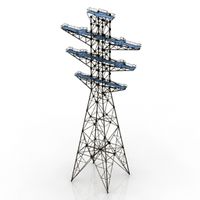
Transmission tower
...lectricity pylon lattice tower framework tower
transmission tower n121015 - 3d model (*.gsm+*.3ds) for exterior 3d visualization.
turbosquid
$5

Lasvit TRANSMISSION
... available on turbo squid, the world's leading provider of digital 3d models for visualization, films, television, and games.
design_connected
$13
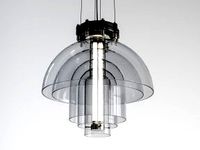
Transmission Sculpture Chandelier
...ture chandelier
designconnected
lasvit transmission sculpture chandelier computer generated 3d model. designed by studio deform.
turbosquid
$25

TRANSMISSION FULL OUTOMATIC
...ee 3d model transmission full outomatic for download as sldas on turbosquid: 3d models for games, architecture, videos. (1331288)
archive3d
free
Transmission tower 3D Model
...mework tower
transmission tower n121015 - 3d model (*.gsm+*.3ds) for exterior 3d visualization.
3d_export
free

tinket planetary transmission
...tinket planetary transmission
3dexport
3ddd
$1
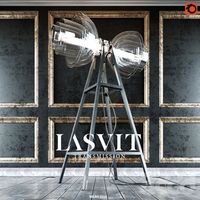
Lasvit Transmission Торшер
...ry angle. glass parts are joined by heat, creating individual elements that become one material and one body.
приятных рендеров)
3ddd
$1
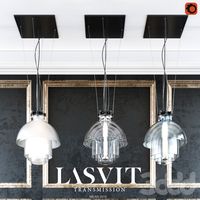
Lasvit Transmission люстры
...ry angle. glass parts are joined by heat, creating individual elements that become one material and one body.
приятных рендеров)
turbosquid
$15

Electrical transmission tower
... available on turbo squid, the world's leading provider of digital 3d models for visualization, films, television, and games.
R
3ddd
$1
ORLANDO R
...orlando r
3ddd
новый стиль
новый стиль - orlando r
design_connected
$11
R-Table
...r-table
designconnected
henge r-table computer generated 3d model. designed by castagna, massimo.
design_connected
$7

Cone R
...cone r
designconnected
bonaldo cone r computer generated 3d model. designed by pasini, ennio.
3ddd
$1
R&B
...r&b
3ddd
r&b
спальный гарнитур r&b;
3d_export
$5

nissan gt-r
...nissan gt-r
3dexport
this is nissan gt-r
turbosquid
$10

R for ROBOT
...osquid
royalty free 3d model r for robot for download as max on turbosquid: 3d models for games, architecture, videos. (1694233)
turbosquid
$5

Letter r
...urbosquid
royalty free 3d model letter r for download as max on turbosquid: 3d models for games, architecture, videos. (1408525)
turbosquid
$5

Letter R
...urbosquid
royalty free 3d model letter r for download as max on turbosquid: 3d models for games, architecture, videos. (1408526)
3d_export
$5
react r
...r 9 lamps (6+3) ø 60 × 21 cm 12 lamps (9+3) ø 80 × 21 cm polys: 208 539 verts: 213 675 https://ru.lampachn.com/react-r-p0551.html
turbosquid
$40
R-73
...uid
royalty free 3d model r-73 for download as blend and fbx on turbosquid: 3d models for games, architecture, videos. (1620664)