Thingiverse
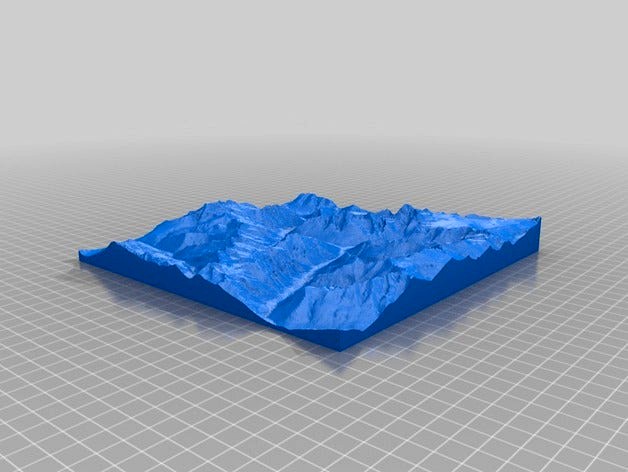
Relief Map of Canada Generator by fizzup
by Thingiverse
Last crawled date: 2 years, 12 months ago
Summary
There are three things here:
A perl script that uses the API at http://geogratis.gc.ca to get relief data about the Earth's surface in Canada and generate the STL file that you can print.
An STL generated by the script for all of Canada in exaggerated scale relief (50x vertical scale).
An STL generated by the script for Rogers Pass in even-scale relief. The pass is an interesting little bit of geography in the Selkirk mountain range in the province of British Columbia. It has some historical significance for Canada. You can read all about it on Wikipedia.
License
The API data is available under the Open Government License – Canada (http://open.canada.ca/en/open-government-licence-canada). Since OGLC allows you to sub-licence, I think it's compatible with CC Attribution. If you are with the Government of Canada and you have some concerns about all this, please let me know in the comments or something. Anyway, RogersPass.stl and Canada.stl contain information licensed under the Open Government Licence – Canada.
If you do take the script and use it for your own nefarious purposes, please be aware that the script is under CC Attribution, but the data that you get from the API is under OGLC.
Running the script
ReliefMap.pl lat=51.2833459 lon=-117.5254215 scale=100000 resolution=1 vfactor=1 x=200 y=200 radius=150 cache=1 file=RogersPass.stl
and
ReliefMap.pl lat=63 lon=-90 scale=27000000 resolution=1 vfactor=50 x=200 y=200 radius=107 cache=1 file=Canada.stl
The script produces ASCII STL, which is unusual and takes up a lot of disk space. If you are going to publish STL, run it through Slic3r first and export the smaller binary STL.
Meaning of the parameters
lat The latitude of the centre point of the map.
lon The longitude of the centre point of the map.
scale The inverse scale of the map (so Rogers Pass is mapped at 1:100,000 and Canada is mapped at 1:2,700,000).
resolution is the minimum distance, in millimeters on the print bed, between two elevation measurements.
vfactor is the scale factor in the z direction as compared to the x/y direction. So the mountains in the Rogers Pass map are even scale, but the relief in the map of Canada is 50 times the x/y scale.
x and y are the rectangular size of the print.
radius is the bounding circle. Due to the way that the triangles are drawn, the map actually sneaks out around the bounding circle. If you have a circular print surface, you need to reduce the radius by one '''resolution''' distance to really bound the map. The map is bound by the x, y, and radius parameters. The map of Canada shows this.
cache is a boolean. It stores the lat/lon values that the script gets from the API so that subsequent runs of the same map are much faster and don't waste your tax dollars.
file is the file name of the STL file that the script generates.
Map projection
The map does not use a cartesian projection, which is unusual in any map. Although the bottom of the map is flat because it has to rest on the print surface the top of the map is not flat, which is the purpose of a relief map anyway.
Since the top surface is not flat in the first place it is not necessary to project the elevation onto a flat surface. Instead, the script projects the elevation onto the surface of the WGS-84 ellipsoid before scaling the model down to fit on the print bed. The WGS-ellipsoid is a smooth model of the Earth's surface that accounts for the equatorial bulge. It is the reference surface for elevations using GPS. The projection is equivalent to cutting a piece out of a globe.
Here is an analogy to help you visualize the projection. The script puts an imaginary ice cream cone inside the Earth, with the pointy part at the centre of the earth and the rim of the ice cream cone in a circle around the central latitude and longitude of the map. The surface of the Earth is the ice cream. It's mostly round, and the land is the gnarly bits of ice cream that stick out. The script cuts off the ice cream at the rim of the cone and you print it on your printer.
Updates
July 24, 2016
Fixed all the defects in drawing triangles. The resulting STL does not have any errors when you load it in Slic3r.
Switched from equirectangular projection to globe projection.
Added a circular bound because a square bound with a globe projection can use a lot of plastic if the map is big.
Added the ability to cache lat/lon values between runs to give the servers at Natural Resources Canada a little bit of a break.
Similar models
3dwarehouse
free

LAT: 40°37'49.96'N / LON: 74°25'18.44'W
...lat: 40°37'49.96'n / lon: 74°25'18.44'w
3dwarehouse
lat: 40°37'49.96'n / lon: 74°25'18.44'w
cg_trader
$18

Choco Ice cream with nice isolation
...am for your scenes
choco ice cream cone 3d model ready for use in rendering projects
3 models for ice cream on the merbal surface
3dwarehouse
free

carroll house
...carroll house
3dwarehouse
'carrolls house' lat=-33.656207121, lon=151.281185718
thingiverse
free

Ice cream cone holder for kids by Aravon
...
simple to print holder for ice cream cone.
for kids and some adults....
no support needed, print with flat surface on print bed.
thingiverse
free

Moonmoon Take 2
...r2014+&cd=1&hl=en&ct=clnk&gl=us )
scaled down to 1440x720 tiff using gdal_translate with average as interpolation
3dwarehouse
free

parasztház
...parasztház
3dwarehouse
lat.: 47.394545° lon.: 19.189505°
cg_trader
$20

Ice Cream Creature | 3D
...m von rueden ice cream creature orlov icecream dessert chocolate frozen cold sweet candy miniatures figurines ice cream ice cream
3dwarehouse
free

josh carroll house
...josh carroll house
3dwarehouse
untitled placemark' lat=-33.6559686633, lon=151.281492255 #lon151281492255
3dwarehouse
free

ice-cream for project do not repot
...ice-cream for project do not repot
3dwarehouse
ice cream tube for project
3dwarehouse
free

Ice Cream
...ice cream
3dwarehouse
you scream, i scream, we all scream 'ice cream!'
Fizzup
thingiverse
free

Finger Clasp by fizzup
... this clasp.
the parts can be printed without support and they are made entirely out of plastic. there is no metal in the hinges.
thingiverse
free

1.75mm filament feed-through. by fizzup
...least not enough to ruin your prints) while still having a small enough hole that molten plastic smells stay inside your cabinet.
thingiverse
free

Customizable Butt Hinge by fizzup
...e and get your affairs in order.
to understand the parameters for this customizer, you will need to understand hinge terminology.
thingiverse
free

Carriage Bolt Seat by fizzup
... torque up the carriage bolt all that tight if you use the plastic seat. probably thumb wheels or wing nuts only, i'm afraid.
thingiverse
free

Beam built-in vacuum inlet flap and seal by fizzup
...cuum inlets, but it fits mine well enough. you'll need an old inner tube and some clear caulk in order to complete this part.
thingiverse
free

Customizable Standard Hinge by fizzup
...e hinge to ribbons.
this hinge takes countersunk #4 wood screws.
to customize this hinge successfully, review hinge terminology.
thingiverse
free

150mm tractrix horn for GramiPhone by fizzup
...p 4, you can delete the bulk of the drawing and only keep the top section if you want to test the fit of the horn into the stand.
thingiverse
free

Figure of Revolution Generator by fizzup
... you are probably going to need to print with support.
it is possible (but a pain) to use b to print a shell rather than a solid.
thingiverse
free

Half paraboloid (parabola of revolution) ear trumpet by fizzup
...ar pads and a half-hoop to be worn like headphones. then you would really look like a doofus so make sure to use a bright colour.
thingiverse
free

Thumb Wheel for a 1/4 - 20 Nut or Bolt by fizzup
... folks, but here in canada it's easier for me to jump through my ear than to get metric parts. an m6 hex head bolt might fit.
Relief
3d_export
$20
relief
...relief
3dexport
relief
turbosquid
$1

Relief
...
turbosquid
royalty free 3d model relief for download as obj on turbosquid: 3d models for games, architecture, videos. (1438537)
3d_export
$15
horse relief
...horse relief
3dexport
horse relief
3d_export
$10

jesus relief
...jesus relief
3dexport
jesus relief
3d_export
$10

rome relief
...rome relief
3dexport
rome relief
3d_export
$10

fish relief
...fish relief
3dexport
fish relief
3d_export
$10

eagle relief
...eagle relief
3dexport
eagle relief
3d_export
$10
eagle relief
...eagle relief
3dexport
eagle relief
3d_export
free

3d relief
...3d relief
3dexport
3d relief
turbosquid
free
Relief
... available on turbo squid, the world's leading provider of digital 3d models for visualization, films, television, and games.
Canada
turbosquid
$100

Canada
... available on turbo squid, the world's leading provider of digital 3d models for visualization, films, television, and games.
turbosquid
$13
map of Canada Map of Canada land border with flag
...and border with flag for download as blend, fbx, obj, and stl on turbosquid: 3d models for games, architecture, videos. (1538823)
turbosquid
$80

Map of Canada
...free 3d model map of canada for download as 3ds, max, and obj on turbosquid: 3d models for games, architecture, videos. (1298089)
turbosquid
$20

Canada redwood
... available on turbo squid, the world's leading provider of digital 3d models for visualization, films, television, and games.
turbosquid
$10
FLAG CANADA
... available on turbo squid, the world's leading provider of digital 3d models for visualization, films, television, and games.
turbosquid
$8

Maple Canada
...el maple canada for download as 3ds, obj, fbx, blend, and dae on turbosquid: 3d models for games, architecture, videos. (1144453)
turbosquid
$1

Flag of Canada
...el flag of canada for download as max, 3ds, dxf, fbx, and obj on turbosquid: 3d models for games, architecture, videos. (1594551)
3ddd
$1
Casetta in Canada
...- mogg
модель- casetta
размер- cm l183xw213xh235
источник-http://www.mogg.it/prodotti/all-the-others/casetta-in-canada/
turbosquid
$11

Animated Canada Waving Flag - Bandera de Canada
...ag - bandera de canada for download as c4d, 3ds, fbx, and obj on turbosquid: 3d models for games, architecture, videos. (1544419)
3d_export
$15

Mailbox Canada
...smax. it has pbr textures 4096x4096 in targa, png, jpeg formats. base_color, mixed_ao, heigt, metallic, roughness, normal_opengl.
Generator
3d_export
$17
Generator
...generator
3dexport
generator
archibase_planet
free
Generator
...base planet
generator electric generator
generator electric n300715 - 3d model (*.gsm+*.3ds+*.max) for interior 3d visualization.
design_connected
$20

Generation
...generation
designconnected
knoll generation computer generated 3d model. designed by formway design.
3d_export
$8

generator
...generator
3dexport
generator - obj, 3ds, fbx.
3d_export
$7

generator
...generator
3dexport
generator extures 4k resolution, basecolor -normal -metallic -ao-roughness-height tris:3084
turbosquid
free
generator
...rator
turbosquid
free 3d model generator for download as max on turbosquid: 3d models for games, architecture, videos. (1492909)
3ddd
$1
general
...general
3ddd
генерал
turbosquid
$99

generator
...urbosquid
royalty free 3d model generator for download as ma on turbosquid: 3d models for games, architecture, videos. (1514125)
turbosquid
$20

Generator
...rbosquid
royalty free 3d model generator for download as max on turbosquid: 3d models for games, architecture, videos. (1244841)
turbosquid
$2
Generator
...rbosquid
royalty free 3d model generator for download as fbx on turbosquid: 3d models for games, architecture, videos. (1245541)
Map
3d_ocean
$5
Map
...map
3docean
geography map ocean travel world world map
a world map
3d_ocean
$5
Old Map
...old map
3docean
dirty map ocean old map paper pirates rotten travel world map
an old map
turbosquid
$3
Map
... available on turbo squid, the world's leading provider of digital 3d models for visualization, films, television, and games.
3d_ocean
$3

Map of Iran
...map of iran
3docean
flag iran map outline
an outline map of iran
3d_ocean
$2

Map of the USA
...map of the usa
3docean
america flag globe map united states usa
an outline map of the usa
3ddd
$1
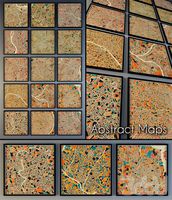
Abstract Maps
... город , picture
abstract maps by artist jazzberry blue
3d_ocean
$5
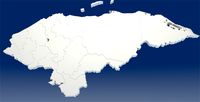
Honduras Map
...honduras map
3docean
3d cinema4d honduras map mapa
honduras map designed in cinema 4d r17
3d_ocean
$2
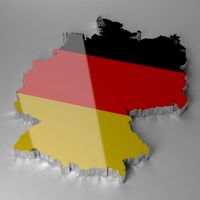
Map of Germany
...map of germany
3docean
black country europe germany gold map outline red yellow
a simple outline map of germany
3d_ocean
$2

Map of Australia
...map of australia
3docean
australia banner country down under earth flag globe map ocean south
an outline map of australia
3d_ocean
$2
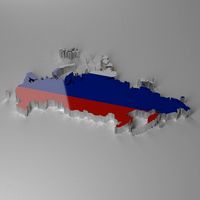
Map of Russia
...of russia
3docean
asia banner earth europe flag globe map russia russian federation siberia sovjet union
an outline map of russia