Thingiverse
Function Grapher by JustinSDK
by Thingiverse
Last crawled date: 4 years, 7 months ago
When remixing OpenSCAD Graph Generator ||, I remembered one thing I still didn't challenge. That is, using the built-in polyhedron module to create a function graph.
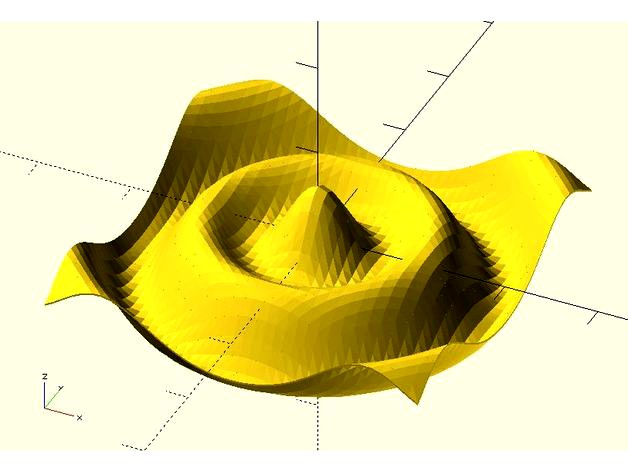
This is a demonstration of the function_grapher module in my library. It's easy to use. For example.
include;
include;
include;
function f(x, y) =
30 * (
cos(sqrt(pow(x, 2) + pow(y, 2))) +
cos(3 * sqrt(pow(x, 2) + pow(y, 2)))
);
thickness = 2;
min_value = -200;
max_value = 200;
resolution = 10;
points = [
for(y = [min_value:resolution:max_value])
[
for(x = [min_value:resolution:max_value])
[x, y, f(x, y)]
]
];
function_grapher(points, thickness);
For more information, please take a look at dotSCAD.
This is a demonstration of the function_grapher module in my library. It's easy to use. For example.
include
include
include
function f(x, y) =
30 * (
cos(sqrt(pow(x, 2) + pow(y, 2))) +
cos(3 * sqrt(pow(x, 2) + pow(y, 2)))
);
thickness = 2;
min_value = -200;
max_value = 200;
resolution = 10;
points = [
for(y = [min_value:resolution:max_value])
[
for(x = [min_value:resolution:max_value])
[x, y, f(x, y)]
]
];
function_grapher(points, thickness);
For more information, please take a look at dotSCAD.