GrabCAD
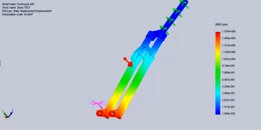
Static and Fatique Analysis of a Fork
by GrabCAD
Last crawled date: 1 year, 10 months ago
Fatigue Analysis
It is observed that repeated loading and unloading weakens objects over time even when the induced stresses are considerably less than the allowable stress limits. This phenomenon is known as fatigue. Each cycle of stress fluctuation weakens the object to some extent. After a number of cycles, the object becomes so weak that it fails. Fatigue is the prime cause of the failure of many objects, especially those made of metals. Examples of failure due to fatigue include, rotating machinery, bolts, airplane wings, consumer products, offshore platforms, ships, vehicle axles, bridges, and bones.
Linear and nonlinear structural studies do not predict failure due to fatigue. They calculate the response of a design subjected to a specified environment of restraints and loads. If the analysis assumptions are observed and the calculated stresses are within the allowable limits, they conclude that the design is safe in this environment regardless of how many times the load is applied.
Results of static, nonlinear, or time history linear dynamic studies can be used as the basis for defining a fatigue study. The number of cycles required for fatigue failure to occur at a location depends on the material and the stress fluctuations. This information, for a certain material, is provided by a curve called the SN curve.
Stages of Failure Due to Fatigue
Failure due to fatigue occurs in three stages:
Stage 1 One or more cracks develop in the material. Cracks can develop anywhere in the material but usually occur on the boundary faces due to higher stress fluctuations. Cracks can occur due to many reasons. Imperfections in the microscopic structure of the materials and surface scratches caused by tooling or handling are some of them.
Stage 2 Some or all the cracks grow as a result of continued loading.
Stage 3 The ability of the design to withstand the applied loads continue to deteriorate until failure occurs.
Fatigue cracks start on the surface of a material. Strengthening the surfaces of the model increases the life of the model under fatigue events.
Performing Fatigue Analysis in Solidworks :
Create one or more static, nonlinear or modal time history dynamic studies.
Create a fatigue study (constant amplitude or variable amplitude) and define its properties. Make sure to set the proper options before running the study.
Notice the events type shown with the name of the Loading folder in the Simulation study tree. Right-click the Loading folder and select Add Event to define a fatigue event based on a reference static study, or on a particular solution step from a nonlinear or modal time history dynamic study. To define a fatigue event based on multiple reference studies, set Loading Type to Find Cycle Peaks.
( Variable amplitude events usually contain large amount of data. The Function Curve dialog lets you import text files containing the data as load history curves. The data become available when defining a variable amplitude fatigue event )
You must define at least one SN curve for each material. Click the Fatigue SN Curves tab in the Material dialog box to define SN curves.
Right-click Result options and select Define/Edit to request results at all nodes or at boundary nodes only. If the study is based on variable amplitude events, you can request the Rainflow matrix chart at the desired locations.
For variable-amplitude fatigue studies, right-click a fatigue event icon and select Plot 3D Rainflow matrix or Plot 2D rainflow matrix to plot a chart for the bins of the input load history
Run the fatigue study.
If the results of a reference study, used in defining an event, are not available, the program runs the reference study automatically before running the fatigue study.
View results:
Double-click an icon in a results folder to display the associated plot.
To define a plot, right-click the Results folder and select the Define Fatigue Plot.
To list results, right-click the Results folder and select List Fatigue Results.
For studies with variable amplitude events, right-click the Results folder and select Define Matrix Charts to view Matrix Charts.
Click here for more result viewing options.
If you run a study before meshing it, the program meshes the study automatically before running it. You can also request to run the study by checking Run analysis after meshing in the Mesh PropertyManager.
When you run a study that does not have any result folders, the software creates the folders and plots specified in the Result Options for the study type. If result folders are present, the software updates the existing plots.
For more : http://help.solidworks.com
Fork : http://grabcad.com/library/front-fork-for-4x-dirt
Hope You Enjoy !
Don't Forget To Like, Comment & Subsribe.
More Projects : http://grabcad.com/ksliak-1/projects
Similar models
grabcad
free

Factor of Safety Analysis of a Bike Frame
...near range.
hope you enjoy !
don’t forget to like, comment & subsribe.
more projects : http://grabcad.com/7liak-1/projects
grabcad
free

Spring FEA Analysis
...is
grabcad
nonlinear static analysis file in midas nfx format (run the simulation and you can get directky the analysis results)
grabcad
free

Structural Analysis of An Alloy Wheel
...l. we are analyze the wheel structure before the mass production.
topics;
equivalent stress
total deformation
fatigue analysis
grabcad
free

Fatigue Analysis
...fatigue analysis
grabcad
stress generated in static structure.
grabcad
free

study analysis
...study analysis
grabcad
study analysis diplacement, stress, and flow analysis.
grabcad
free

AIRCRAFT WING TO FUSILAGE ATTACHMENT
...aircraft wing to fusilage attachment
grabcad
sn based fatigue analysis using nastran nx
grabcad
free

Simply supported beam analysis
...ported beam under varying loads. total deformation, shear stress due to bending, stress & strain (equivalent) are calculated.
grabcad
free

External Spur Gear Pair Stress Analaysis In SolidWorks 2019
...have become too large (~780mb).
if you have any questions or opinion please share with me in the comments section!
thank you! :)
grabcad
free

Fuel Tank
... study i will look at the analysis of each type of failure and finally determine the thickness avoiding these risks of fractures.
grabcad
free

Crane Hook
...his crane can bears big load.
just make a stress analysis on it and upload the model again in it's folder with results.
thanx
Fatique
thingiverse
free

Trampa Concave Pads
...pads in combination with bindings, it will decrease foot fatique and give you more control over the board. the...
thingiverse
free

Replacement mount garage door by gplv
...given stress. the metal always broke due to metal fatique and being made from cheap and brittle metal. chose...
grabcad
free

Ekskavatör kepcesi
...analizi. yükseklik 630mm uzunluk 800mm. excavator bucket design and fatique analysys. height 630mm and lenght...
cg_trader
free

Coronavirus COVID19
...syndrome wuhan china 2019 hospitals fever caughing breathing symptoms fatique medical...
grabcad
free

Rolling flex hinge
...for hinging. however, the amount of flexing (and consequently fatique is much less than a traditional living hinge because...
grabcad
free

Four Point Contact Ball Bearing
...mm c :186 kn c statique : 200 kn fatique limite : 7,65 kn ref. speed : 5000 rpm...
grabcad
free

Test Rig
...test rig grabcad fatique test...
grabcad
free

Bending Fixture
...bending fixture grabcad fatique bending test...
cg_trader
free

Bending Fixture
...bending fixture cg trader fatique bending test...
Analysis
3d_ocean
$6
Chairs and Table
...blender 3d. exported to different formats: .obj;.3ds;.blend;.dae;.fbx;.ply;.x3d;.mtl . site analysis ...
3d_ocean
$35
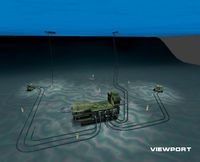
subsea oil or gaz production
...subsea oil or gaz production 3docean analysis earth's interior gas gas company gas industry industry marine...
3d_export
free
lumped vehicle suspension system
...lumped vehicle suspension system 3dexport lumped_vehicle_suspension_system analysis by comsol.<br>accurate results can be taken by just changing...
3d_export
$25

automobile valve assembly machine
...only a small change. this is the most valuable analysis and research equipment in the automation industry at present....
3d_export
$5
wind turbine
...turbine and can be used by students for their analysis projects using...
3d_export
$12

perfect shaped skull basemesh
...by reference references and photos, but also by comparative analysis with many references made using photogrammetry<br>clean topology, no errors,...
3d_export
$10
Recessed shell bitts
...coating etc are optional; 3.one year quality warranty; 4.chemical analysis report 5.dimensional as-built...
3d_export
$100
turbine a gaz 9fa general electrique
...on the general eclectic 9fa turbine in the static analysis only the vane part is shown when examining the...
3d_export
$59

Modern contemporary park with 3d grass
...using conceptual mass and adaptive components, along with concept, analysis vegetation selection, shading areas and circulation presentation in the...
3d_export
$120

tesla
...specialist in 3d modeling with solidworks & ansys for analysis iam car designer with a very diverse experience. i...
Static
3d_ocean
$15
Highpoly 3d Model of Electrostatic Machine
...al polygons: 75.202 textures: yes materials: yes rigged:no animated: no uv mapped: no unwrapped uvs: yes cameras: 0 lights: 0 ...
3d_ocean
$9

Workman
...adult character construction human lowpoly male man old realistic static work worker workman low polygonal 3d model of workman...
3d_ocean
$29

Stickman - 6 suit pack - Full Rig
...which can be used in any animation movie or static shots. has already finished 6 suits. has simple uv...
3d_ocean
$5

USB Collection
...or text and it is ready for animation or static render. the purchase...
3d_ocean
$15

Snow_M_B_200515
...high-res texture so you can also use them for static renders. -no need for any special plug-in to open...
3d_ocean
$5

Bulb
...high poly house interior light lighting low poly model static this is a 3d model of a bulb created...
3d_ocean
$15

Snow_M_A_020515
...high-res texture so you can also use them for static renders. -no need for any special plug-in to open...
3d_ocean
$15

Brown_C_29042015
...high-res texture so you can also use them for static renders. -no need for any special plug-in to open...
3d_ocean
$5

Flag
...flag model is not animated. it’s only meant for static renders. it was...
3d_ocean
$30
Photorealistic Fan - Ready to Render
...with animation and motion blur and the is other static the scene includes 14 different shaders. i...
Fork
3d_export
$10

Cutlery 3D Model
...cutlery 3d model 3dexport cutlery fork knife spoon teaspoon soup engraved silver coffee stainless cutlery...
3d_export
$59

Zepter BlackWhite set 3D Model
...3d model 3dexport zepter glass plate pot cap spoon fork knife dishes magic harmony fine set black white champagne...
3d_export
$25

Merida Cyclo Cross Carbon Team 2012 frame set 3D Model
...3dexport bicycle bike frame merida cyclo cross carbon 2012 fork textured team printable merida cyclo cross carbon team 2012...
3d_ocean
$5

Utensils
...utensils 3docean cutlery dessert fork dishes eating eating irons eating utensils fish knife flatware...
3d_ocean
$5

Utensils
...utensils 3docean breakfast coffee cutlery dessert fork dinner dishes eating eating irons eating utensils fish knife...
3d_ocean
$19

Dinner set on table
...dinner set on table 3docean ceramic dinner eat eating fork glass knife plate porcelain spoon table vase dinner set...
3ddd
$1
Торшер Fork Terra
...торшер fork terra
3ddd
diesel
торшер fork terra от фирмы diesel
висота 186мм
archive3d
free
Autoloader 3D Model
...autoloader 3d model archive3d autoloader forkift fork-lift truck forklift truck autoloader forklift 2 n120614 -...
archive3d
free

Autoloader 3D Model
...autoloader 3d model archive3d autoloader forkift fork-lift truck forklift truck autoloader 1 n120614 - 3d...
archive3d
free

Autoloader 3D Model
...autoloader 3d model archive3d autoloader lift-truck forklift truck elevator erd 220 n060913 - 3d model (*.gsm+*.3ds+*.max)...